
Execution History & Archiving
Tracking test suite health over time is essential for identifying degradation before releases. Zen Reporter automatically logs execution runs to JSONL archives and provides interactive historical views: History, File History, and Test History.
📦 JSONL Archive Mechanism
Section titled “📦 JSONL Archive Mechanism”When history archiving is enabled (enableHistory: 'auto' or true), Zen Reporter writes a lightweight .jsonl record for every test run to:
<outputDir>/runs/<run_id>.jsonlJSONL Schema Structure
Section titled “JSONL Schema Structure”Each line in a run JSONL file records a flattened test case result alongside run-level summary metrics and step statistics.
Field Reference
Section titled “Field Reference”- Run Metadata & Benchmarks:
run_id: Unique timestamped identifier for the execution run.run_name: Test run name (e.g.,"Unit Tests Run #146").project_name: Configured project title (e.g.,"Zen Reporter").started_at/ended_at: ISO timestamp strings for run start and completion.run_duration_ms: Total wall-clock execution duration in milliseconds.run_sequential_duration_ms: Cumulative execution duration across worker threads.run_workers/run_projects: Worker threads and Playwright project profiles utilized.
- Run Outcome Totals:
run_total,run_passed,run_failed,run_skipped,run_timed_out,run_interrupted: Overall execution counts for the run.
- Run Step Categorization:
step_assertions,step_actions,step_network,step_hooks,step_waits,step_others: Total step occurrences per category across the entire run.
- Individual Test Case Attributes:
file: Relative test spec file path.suite: Parentdescribesuite title hierarchy.title: Test case title.project: Target Playwright project profile (e.g.,"chromium").status: Outcome (passed,failed,timedOut,skipped,interrupted).duration_ms: Test execution duration in milliseconds.attempts/failed_attempts: Total execution attempts and failed attempts.passed_on_retry: Boolean flag indicating if the test recovered on retry (flaky test).error_message,error_stack,error_file,error_line: Error diagnostics and location if the test failed.tags: Array of custom@tagannotations attached to the test or suite.
📊 History Tab Views
Section titled “📊 History Tab Views”The History tab in the report UI offers three sub-views:
1. Execution Runs History View
Section titled “1. Execution Runs History View”Lists past test execution runs in reverse chronological order:
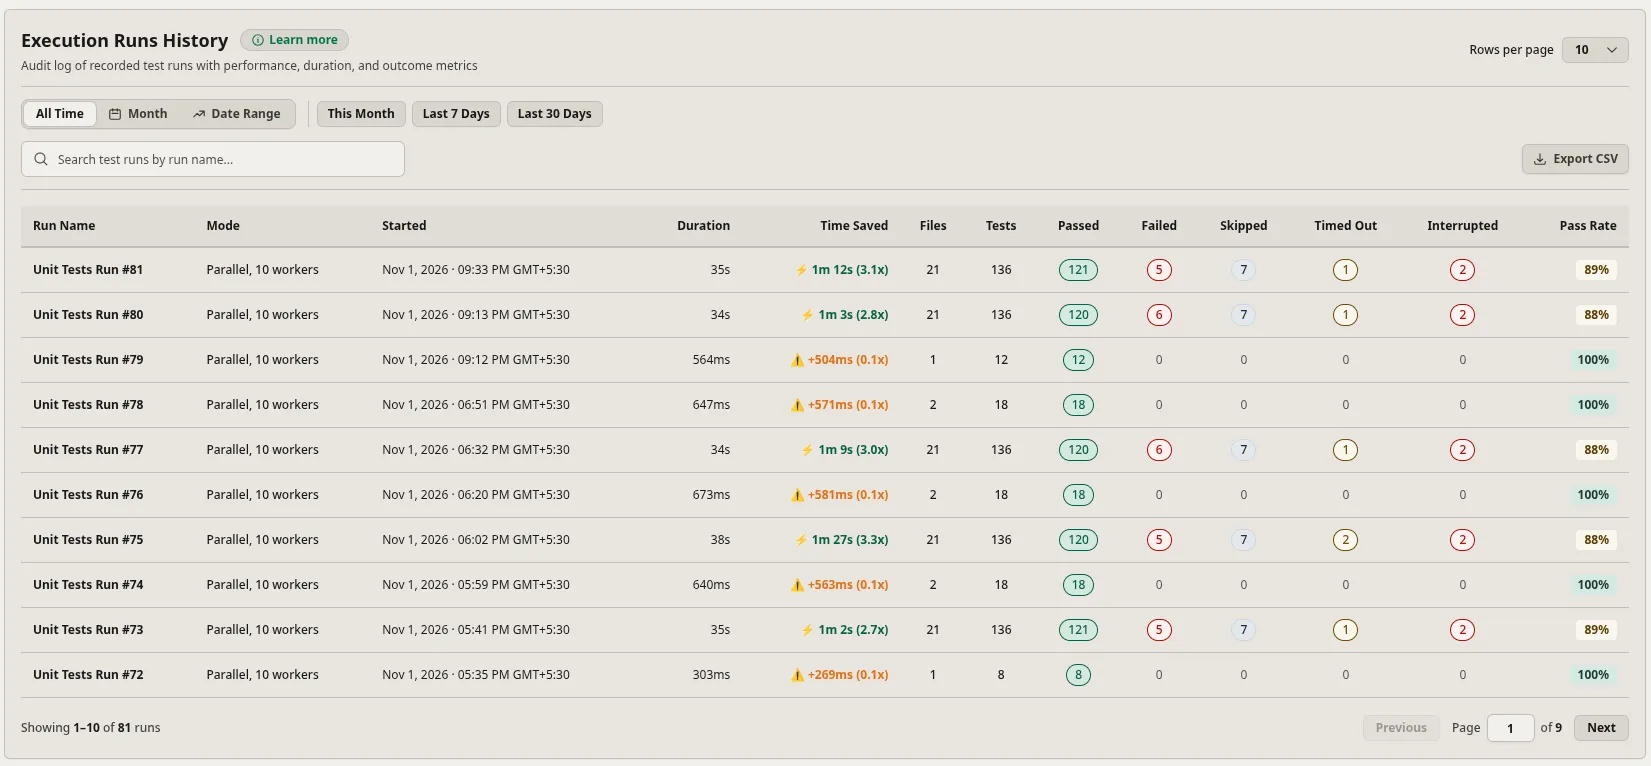
- Date Range & Filter Presets: Quick preset filter buttons (
All Time,Month,Date Range,This Month,Last 7 Days,Last 30 Days). - Live Search & Export: Filter runs by run name (
Search test runs by run name...) and one-click Export CSV button. - Detailed Run Table Columns:
- Run Name: Custom run identifier (e.g.,
Unit Tests Run #146). - Mode: Execution mode and worker allocation (e.g.,
Parallel, 10 workers). - Started: Formatted start timestamp with timezone.
- Duration: Total execution wall-clock time (e.g.,
31s,366ms). - Time Saved: Calculated parallelism time savings and speedup multiplier (e.g.,
⚡ 45s (2.5x)), or yellow slowdown warnings if sequential effort was lower. - Files: Total count of evaluated spec files included in the run (e.g.,
21). - Tests: Total test cases evaluated across all suites and projects for the run (e.g.,
136). - Status Breakdown: Pill-highlighted counts for
Passed(green),Failed(red),Skipped(soft blue),Timed Out(amber), andInterrupted(red). - Pass Rate: Overall run pass percentage badge (e.g.,
77%,83%,100%,0%).
- Run Name: Custom run identifier (e.g.,
- Pagination: Configurable page size (
Rows per page: 10) withPreviousandNextnavigation.
2. File Execution History View
Section titled “2. File Execution History View”Aggregates historical performance at the spec file level across all executed runs:
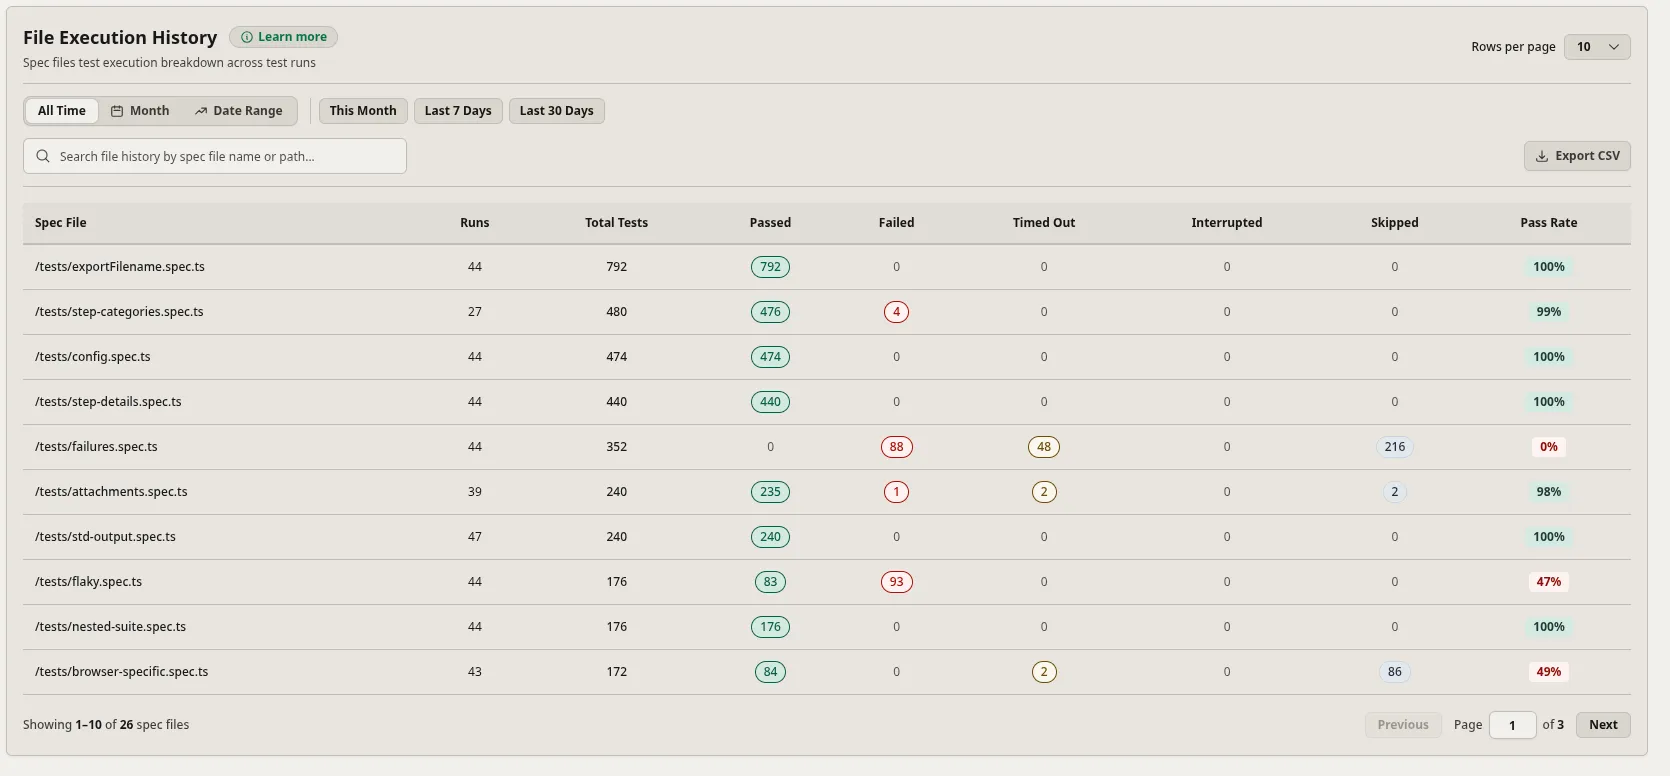
- Filter & Search Toolbar: Preset date filters (
All Time,This Month, etc.), instant search input (Search file history by spec file name or path...), andExport CSVbutton. - Spec File Metrics Columns:
- Spec File: Relative file path of the test spec.
- Runs: Total number of runs that included this spec file (e.g.,
115,129). - Total Tests: Cumulative test cases executed from this file across all runs.
- Historical Outcome Totals: Aggregated counts for
Passed,Failed,Timed Out,Interrupted, andSkipped. - Pass Rate: Cumulative historical pass percentage for the spec file (e.g.,
100%,98%,43%,0%).
3. Test Case History View
Section titled “3. Test Case History View”Provides granular historical tracking for individual test cases across runs:
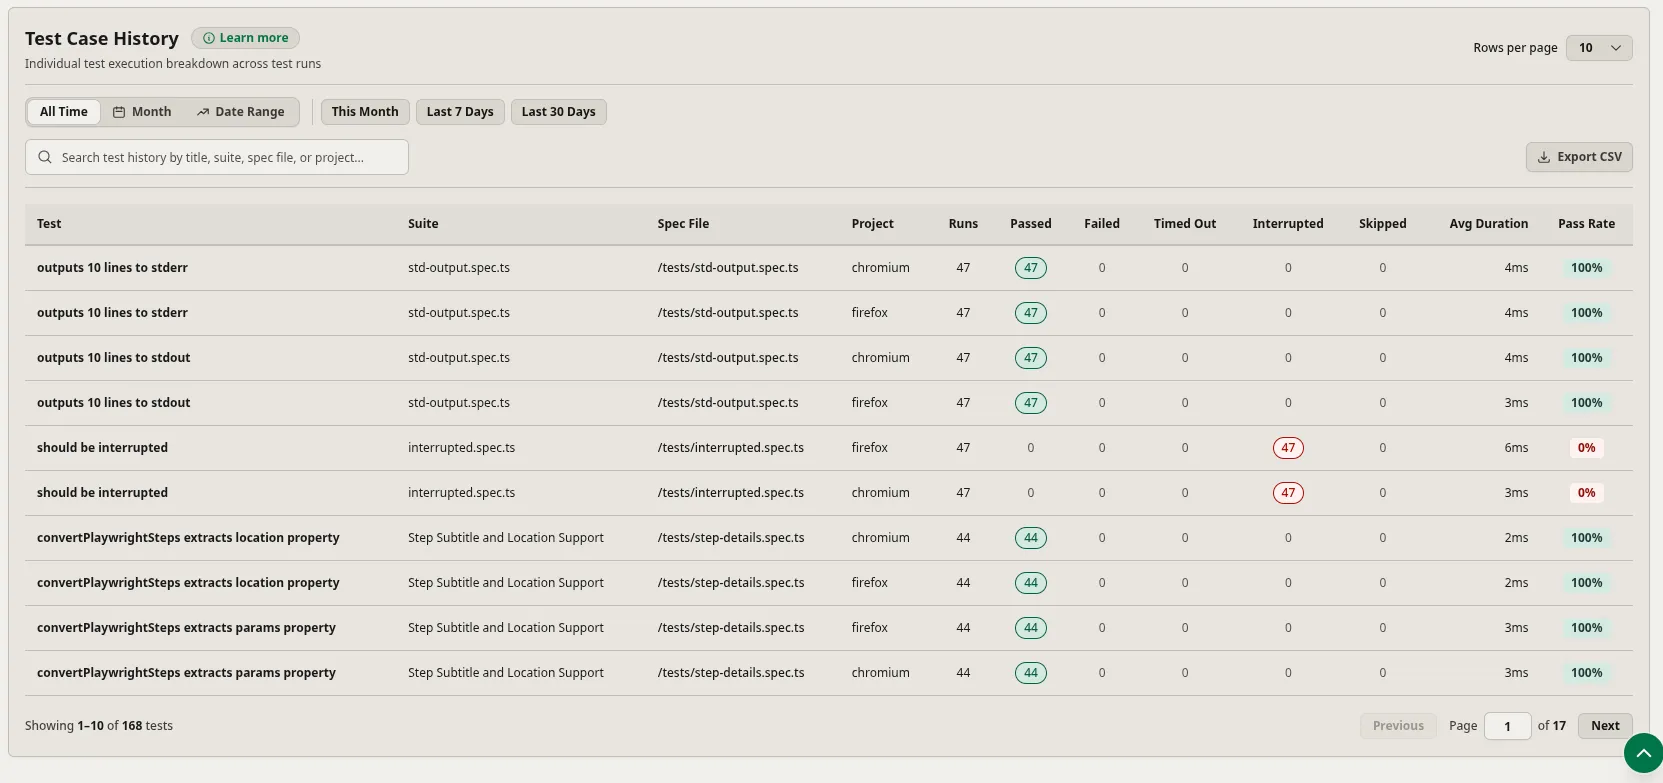
- Multi-Field Search: Live search filtering by test title, suite, spec file, or project name (
Search test history by title, suite, spec file, or project...). - Granular Test Case Columns:
- Test: Name / title of the individual test case.
- Suite: Name of the parent
describesuite. - Spec File: Source spec file path.
- Project: Playwright browser profile (
chromium,firefox, etc.). - Runs: Total runs evaluating this test.
- Outcome Totals: Cumulative
Passed,Failed,Timed Out,Interrupted, andSkippedcounts. - Avg Duration: Historical average execution duration for the test case (e.g.,
5ms,7ms,2s). - Pass Rate: Cumulative pass rate percentage badge.
📈 Trends View & Charts
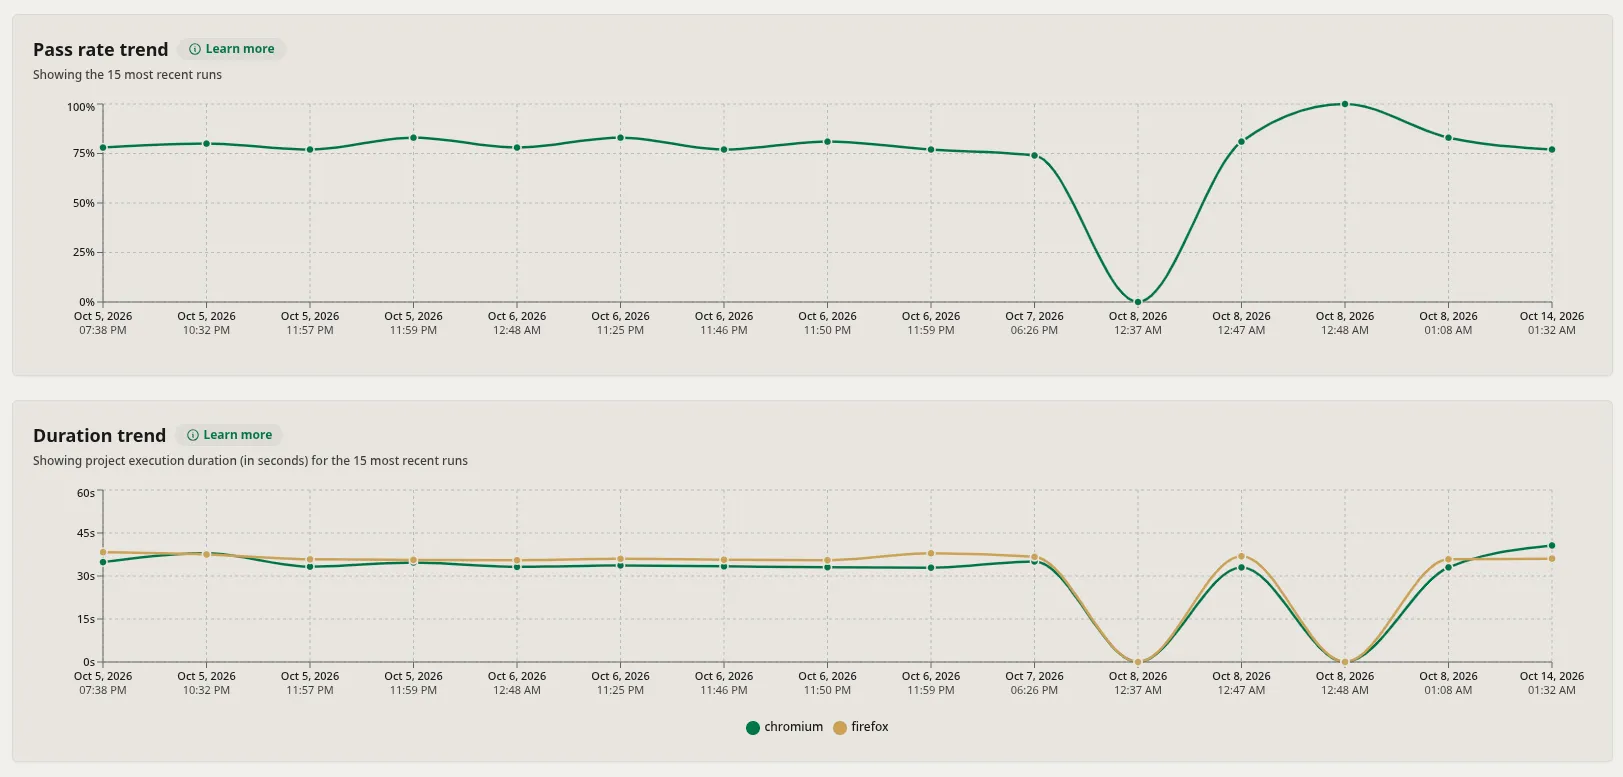
Section titled “📈 Trends View & Charts”The Trends tab in the report UI visualizes long-term quality, performance, and test composition metrics across historical runs:
-
Pass Rate Trend Chart:
- Interactive line chart tracking pass rate percentages across the 15 most recent runs, highlighting quality spikes or drops.
- Hover tooltips provide exact timestamps and pass rates for each historical run point.
-
Duration Trend Chart:
- Multi-line chart displaying execution wall-clock time (in seconds) for each Playwright project profile (
chromium,firefox) across recent runs. - Easily spot duration spikes, performance regressions, or browser-specific slowdowns.
- Multi-line chart displaying execution wall-clock time (in seconds) for each Playwright project profile (
-
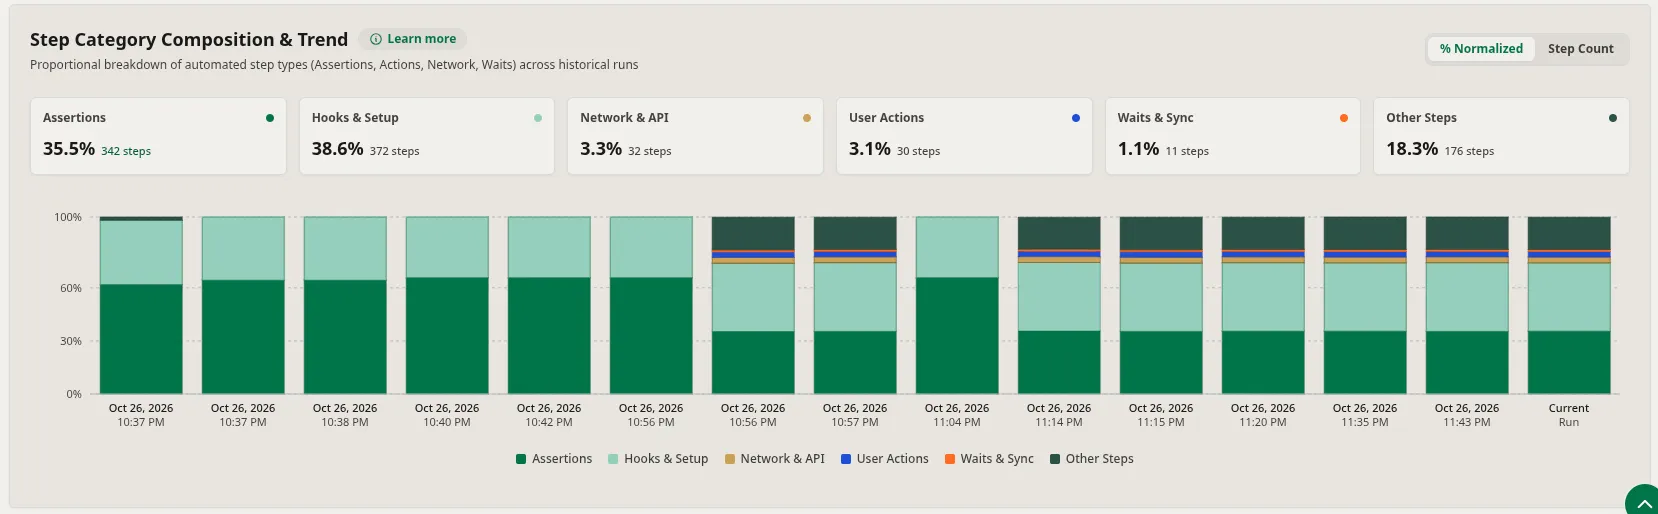
Step Category Composition & Trend Chart:
- View Modes: Toggle between
% Normalized(proportional stacked bar breakdown) andStep Count(raw count distribution). - Top KPI Summary Cards: Live breakdown of current step distribution:
- 🟢 Assertions Ratio: Proportion and count of
expectassertions (e.g.,24.2% · 94 steps). - 🟢 Hooks & Setup: Time spent in fixtures and lifecycle hooks (e.g.,
49.5% · 192 steps). - 🟡 Network / API: Proportion and count of network and API requests.
- 🔵 User Actions: UI interactions like clicks, fills, and navigation (e.g.,
4.6% · 18 steps). - 🟠 Explicit Waits / Sync: Time spent waiting on elements or timeouts.
- 🟢 Other Steps: Miscellaneous test steps and framework internals (e.g.,
21.6% · 84 steps).
- 🟢 Assertions Ratio: Proportion and count of
- Historical Stacked Bar Comparison: Compare historical runs side-by-side against the Current Run to catch setup bloat, runaway hooks, or missing assertion steps.
- View Modes: Toggle between
💡 Managing History Archives
Section titled “💡 Managing History Archives”Rebuilding History Analytics (zr history report)
Section titled “Rebuilding History Analytics (zr history report)”If you add or modify .jsonl files in <outputDir>/runs/, re-run the CLI aggregator command to update history.json and inject updated metrics into index.html:
npx zr history reportDisabling History
Section titled “Disabling History”For single-run disposable CI environments, disable history archiving by setting enableHistory: false or minimalReport: true in your Playwright config.